Crime Project
I believe that I was successful during this project. The whole goal was to understand and explore data as well as data organization. I know now that the quantities, characters, or symbols on which operations are performed by a computer, being stored and transmitted in the form of electrical signals and recorded on magnetic, optical, or mechanical recording media.This is very important information in context of today’s world and I am glad for this opportunity.
From this unit I learned many things. I can understand the complexities of collecting and analyzing large sets of data, identify research questions or describe the stories or discoveries they plan to uncover through the analysis of gathered data, create spreadsheets, charts, and graphs, and display the data in the form of an infographic. This is important because now I can use this in any sort of job I may find myself in. In this class I learned about data analysis and how to use computers to my full advantage. This skill is very useful because today’s world is encompassed by IT and other jobs of the like. I can use this knowledge to get a job.
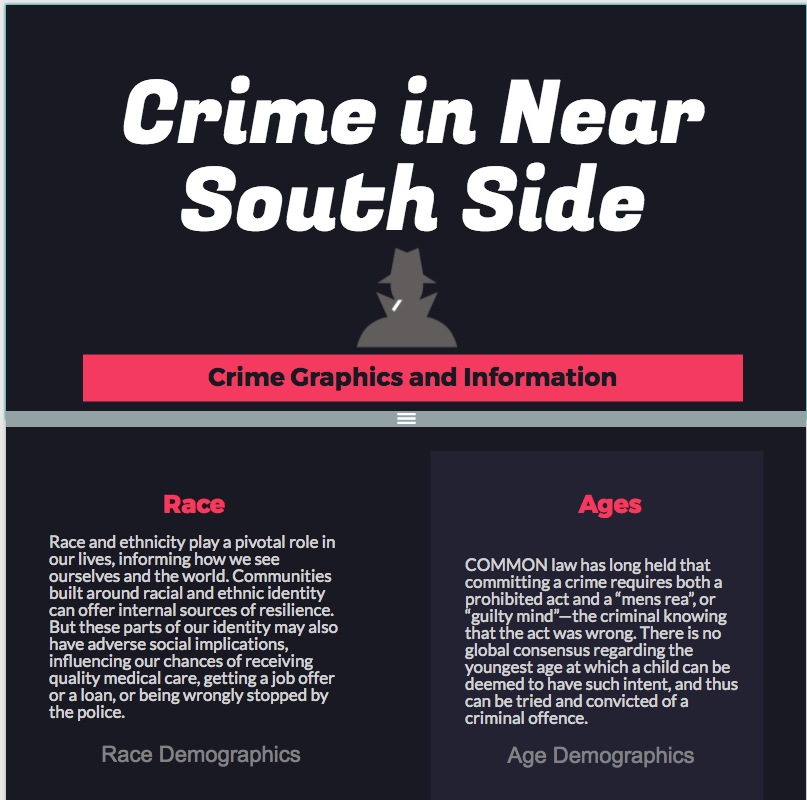
New questions I have involve how the computer actually works. I have already learned about the functions of the computer and how I can use it, but now I would like to learn how it knows how to carry them out and such. I used spreadsheets to categorize, collect, and display my data in a clear format. A spreadsheet is an electronic document in which data is arranged in the rows and columns of a grid and can be manipulated and used in calculations. Examples of how I used them can be found in the community demographics spreadsheet and in the clearmap activity. Infographics are a visual image such as a chart or diagram used to represent information or data. I used them to display data on crime in the Near South Side community of Chicago. They were very useful to display my collected data in a way that was easy to comprehend and read.
Data analysis, also known as analysis of data or data analytics, is a process of inspecting, cleansing, transforming, and modeling data with the goal of discovering useful information, suggesting conclusions, and supporting decision-making. It is important because it allows us to make sense of the facts surrounding our world. I thought that compiling and putting together the data was the most difficult because it felt tedious and was aggravating because you could lose your place easily. I overcame this however and when I got to displaying the data in the infographic I found it nice. I didn’t find any part of the project easy because all of the information was completely new to me. I had never encountered data analytics before, but coming out of the unit I feel confident in my understanding and comprehension.
From this unit I learned many things. I can understand the complexities of collecting and analyzing large sets of data, identify research questions or describe the stories or discoveries they plan to uncover through the analysis of gathered data, create spreadsheets, charts, and graphs, and display the data in the form of an infographic. This is important because now I can use this in any sort of job I may find myself in. In this class I learned about data analysis and how to use computers to my full advantage. This skill is very useful because today’s world is encompassed by IT and other jobs of the like. I can use this knowledge to get a job.
New questions I have involve how the computer actually works. I have already learned about the functions of the computer and how I can use it, but now I would like to learn how it knows how to carry them out and such. I used spreadsheets to categorize, collect, and display my data in a clear format. A spreadsheet is an electronic document in which data is arranged in the rows and columns of a grid and can be manipulated and used in calculations. Examples of how I used them can be found in the community demographics spreadsheet and in the clearmap activity. Infographics are a visual image such as a chart or diagram used to represent information or data. I used them to display data on crime in the Near South Side community of Chicago. They were very useful to display my collected data in a way that was easy to comprehend and read.
Data analysis, also known as analysis of data or data analytics, is a process of inspecting, cleansing, transforming, and modeling data with the goal of discovering useful information, suggesting conclusions, and supporting decision-making. It is important because it allows us to make sense of the facts surrounding our world. I thought that compiling and putting together the data was the most difficult because it felt tedious and was aggravating because you could lose your place easily. I overcame this however and when I got to displaying the data in the infographic I found it nice. I didn’t find any part of the project easy because all of the information was completely new to me. I had never encountered data analytics before, but coming out of the unit I feel confident in my understanding and comprehension.
Artifacts